What is the Design of Experiments (DoE)?
DoE is a web-based application developed by Simulate 365 to carry out multidimensional sensitivity studies using Excel. DoE allows to explore the effects of multiple input and output relationships on a process with individual sampling strategies.
Who can benefit from DoE?
DoE can be useful for a wide range of users, including:
Researchers who want to understand the effect of different variables on a specific outcome or response.
Engineers who are developing new products or improving existing ones, and need to identify the optimal process parameters to achieve the desired outcome.
Quality control professionals who need to identify the key factors that affect product quality and optimize the production process accordingly.
Operations managers who want to improve efficiency and reduce costs by identifying and eliminating sources of variability in their processes.
Anyone who wants to quantify the influence of multiple parameters on the process performance.
Getting Started with DoE:
Prerequisites
- You have a converging DWSIM flowsheet.
- Simulate 365 account
DoE can only interact with DWSIM flowsheets uploaded on Simulate 365 Dashboard.
To access Dashboard, sign up via https://simulate365.com/registration/, activate your account and access Dashboard on https://dashboard.simulate365.com/. - DoE Access
Login to Simulate 365 to find the Product. You can get a 2-week free trial to try DoE.
Tutorial
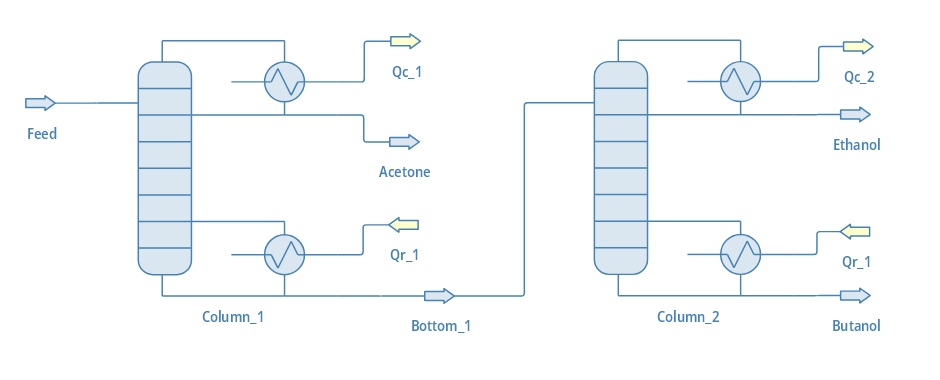
We use a simple flowsheet for the separation of an Acetone-Butanol-Ethanol mixture to demonstrate how to use DoE for multidimensional calculations. The following figure shows the Process Flow Diagram (PFD) of the converging flowsheet.
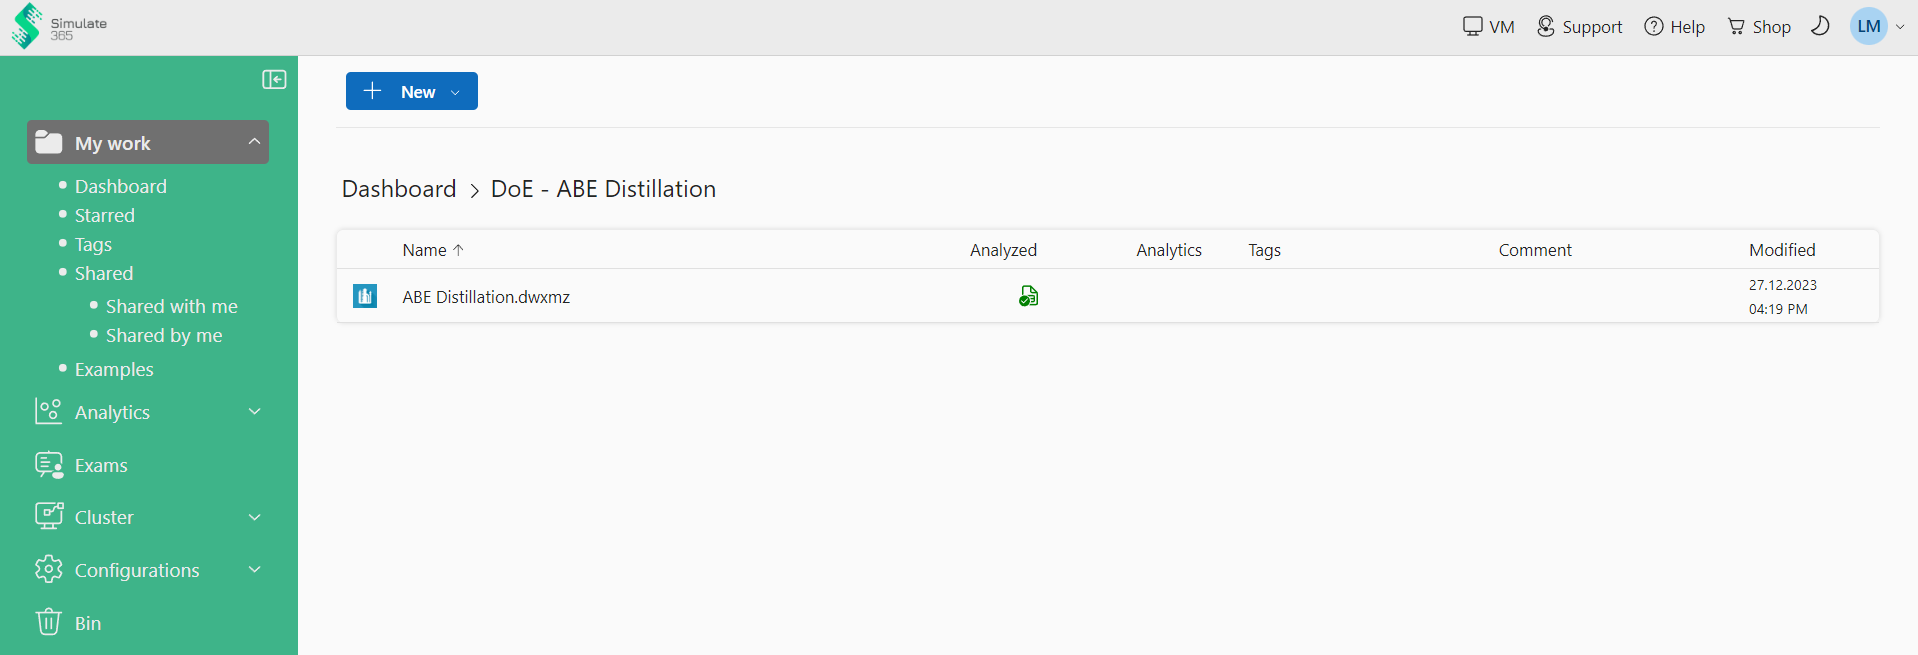
Step 1: Upload the DWSIM flowsheet
Upload a DWSIM flowsheet to Simulate 365 Dashboard and let it analyze.
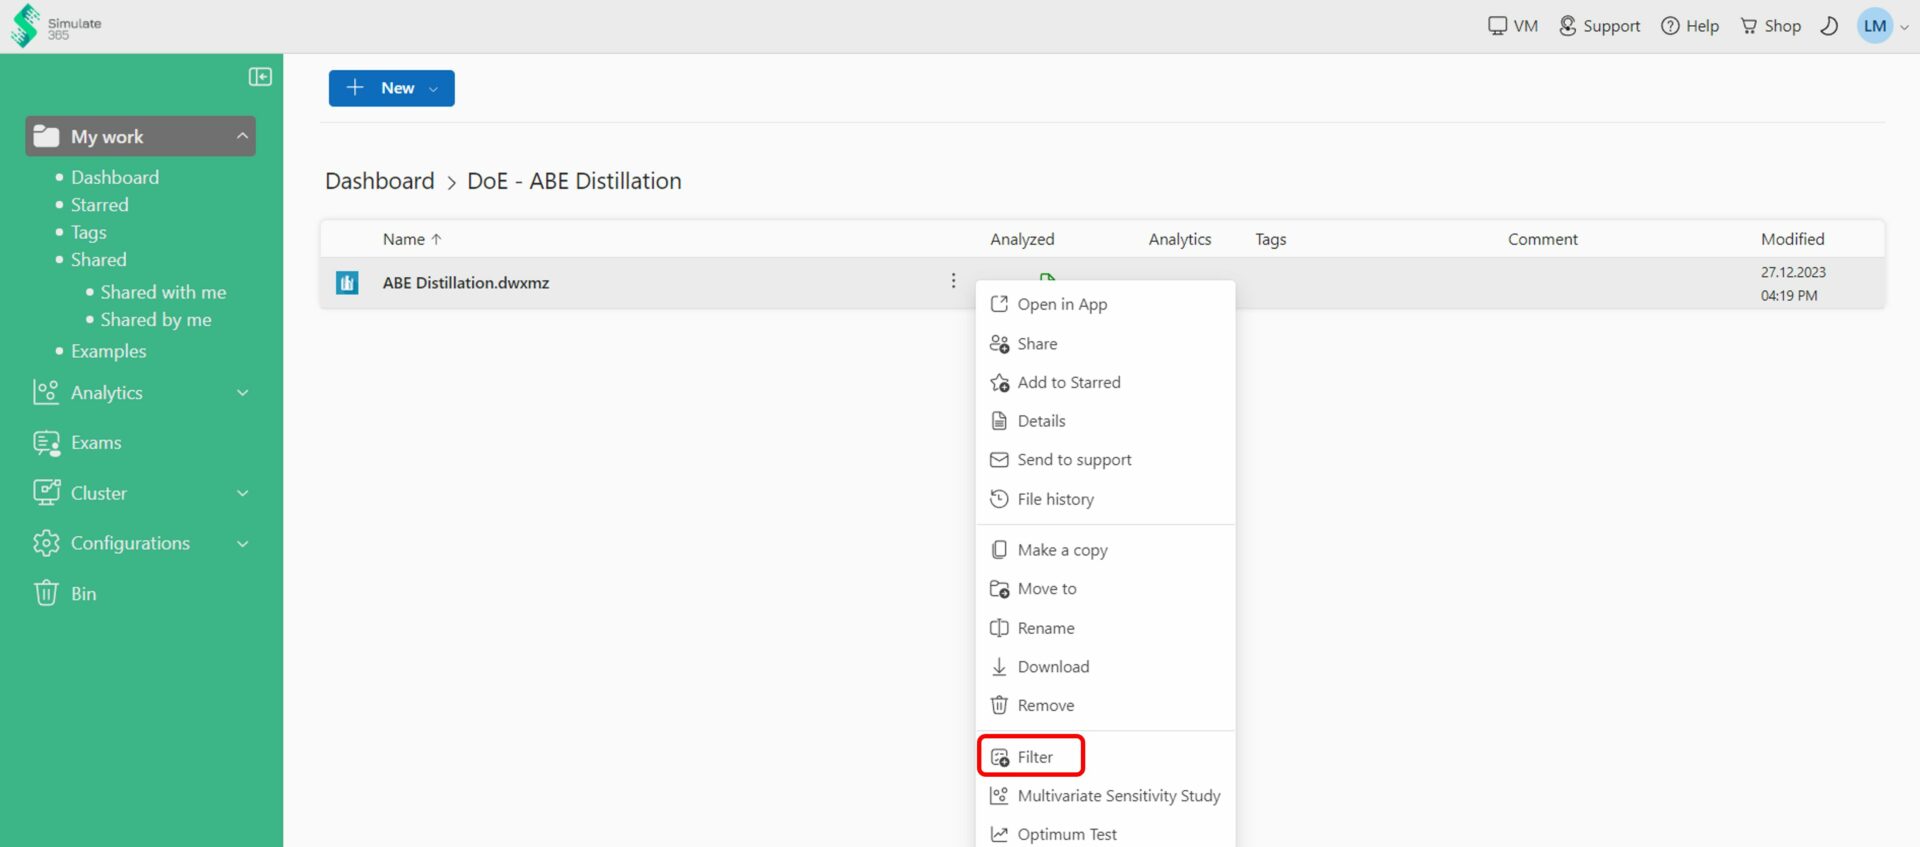
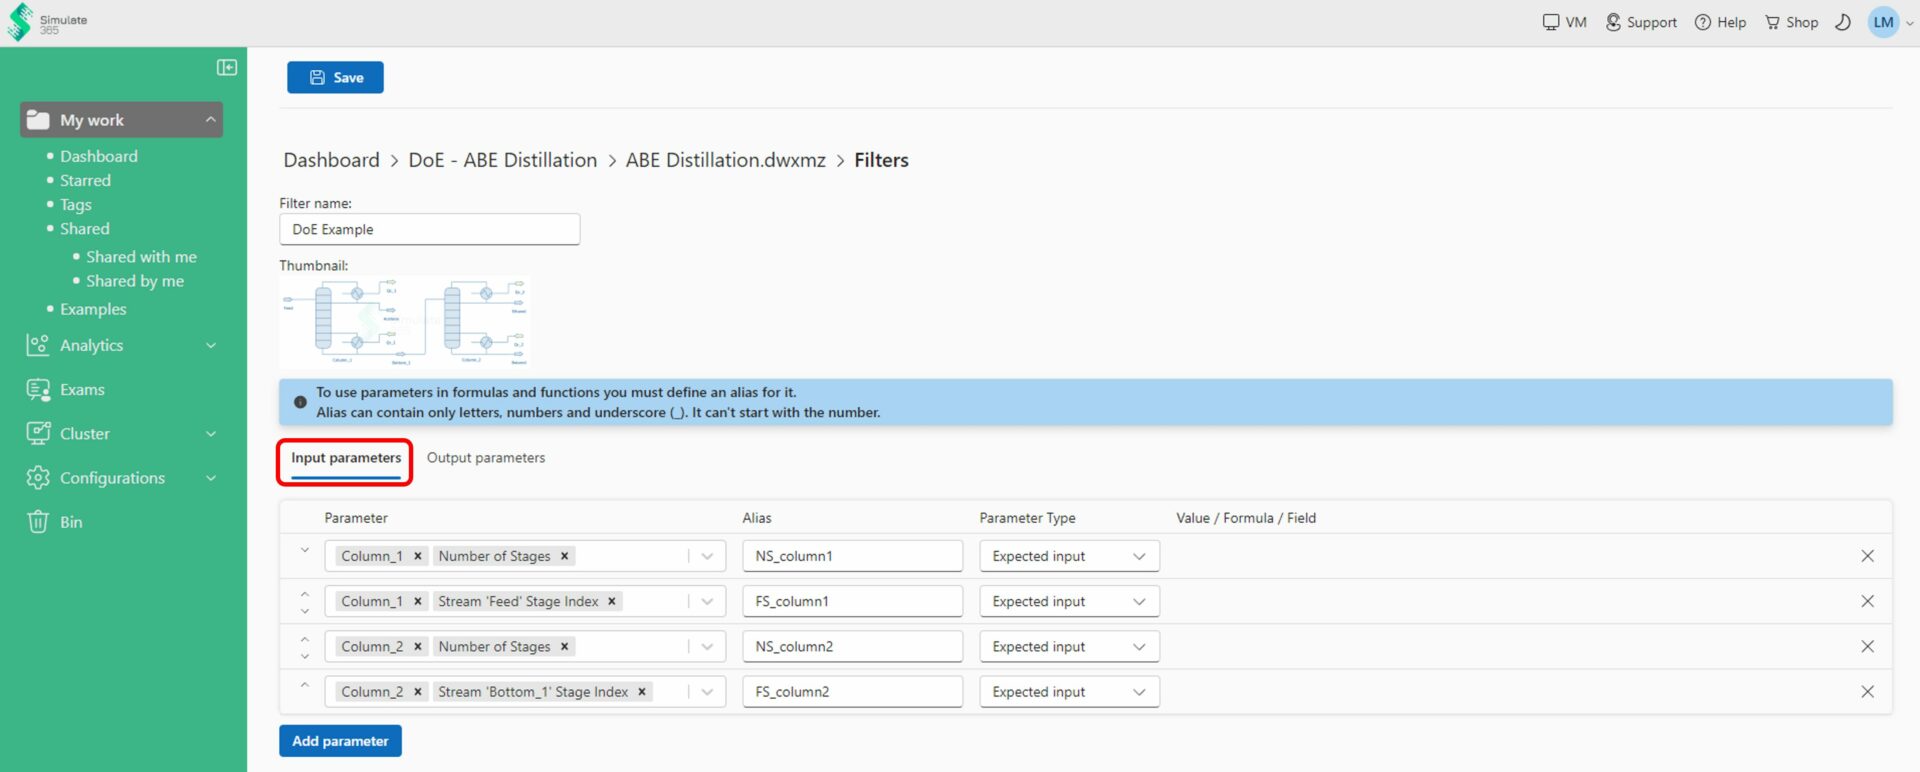
Step 2: Create a Filter to specify input and output parameters
Right-click on your flowsheet and access “Filter” to specify the input and output parameters for the study.
Create a “New Filter” and define a name.
To specify the inputs and outputs, select a Unit Operation or Stream, the desired parameter of the Unit Operation or Stream and define an Alias. In this example we define the number of stages and feed stage location of both columns as inputs and the purities of the outlet streams as outputs.
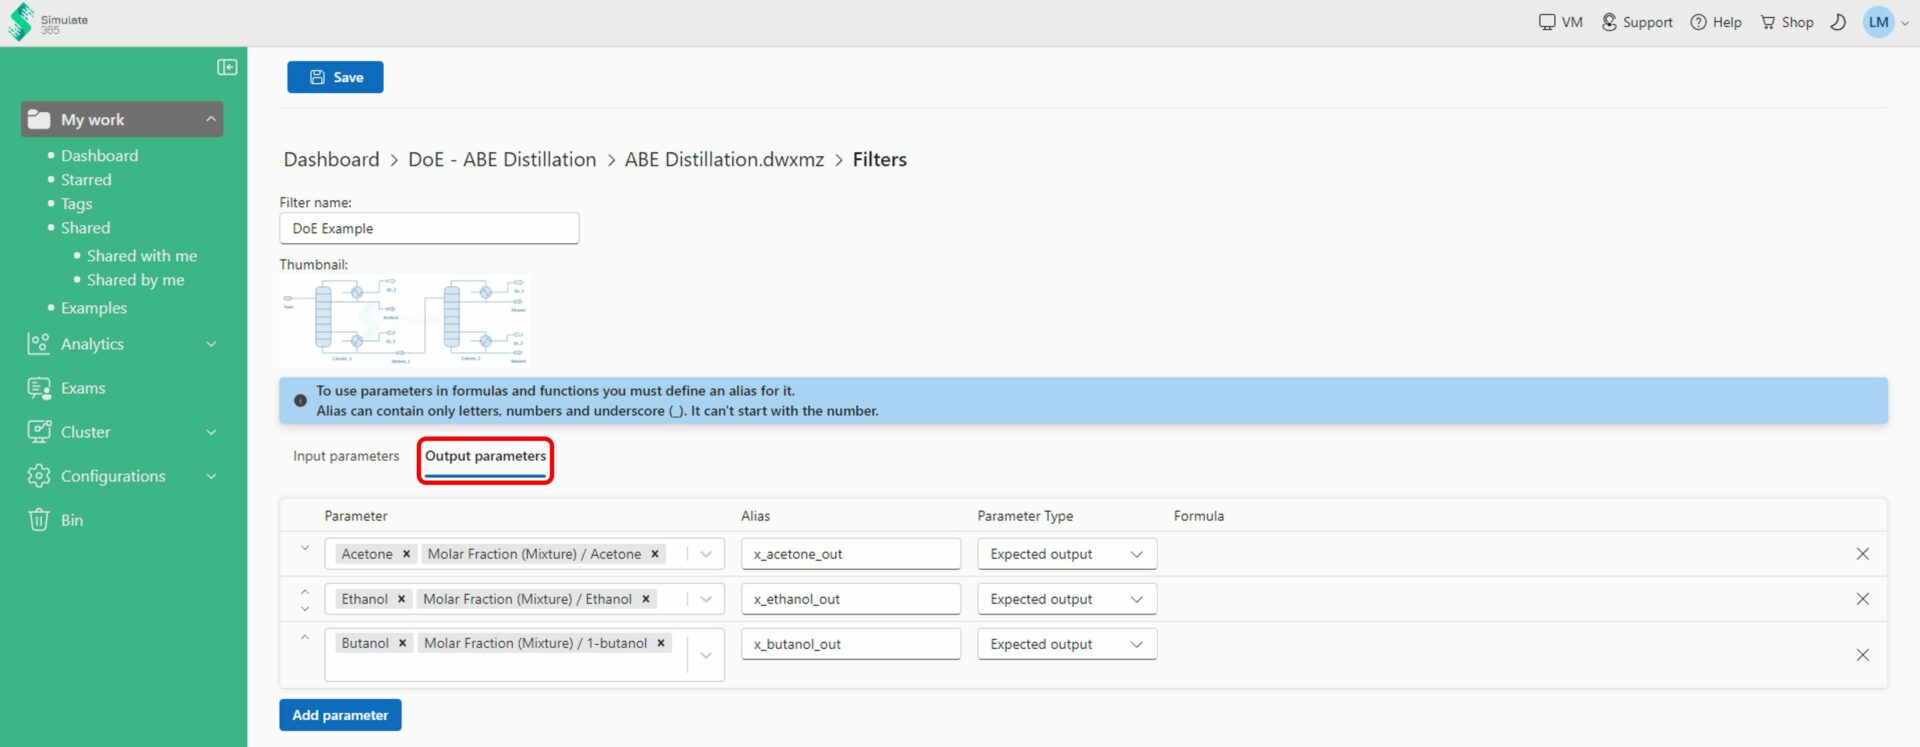
Save the Filter
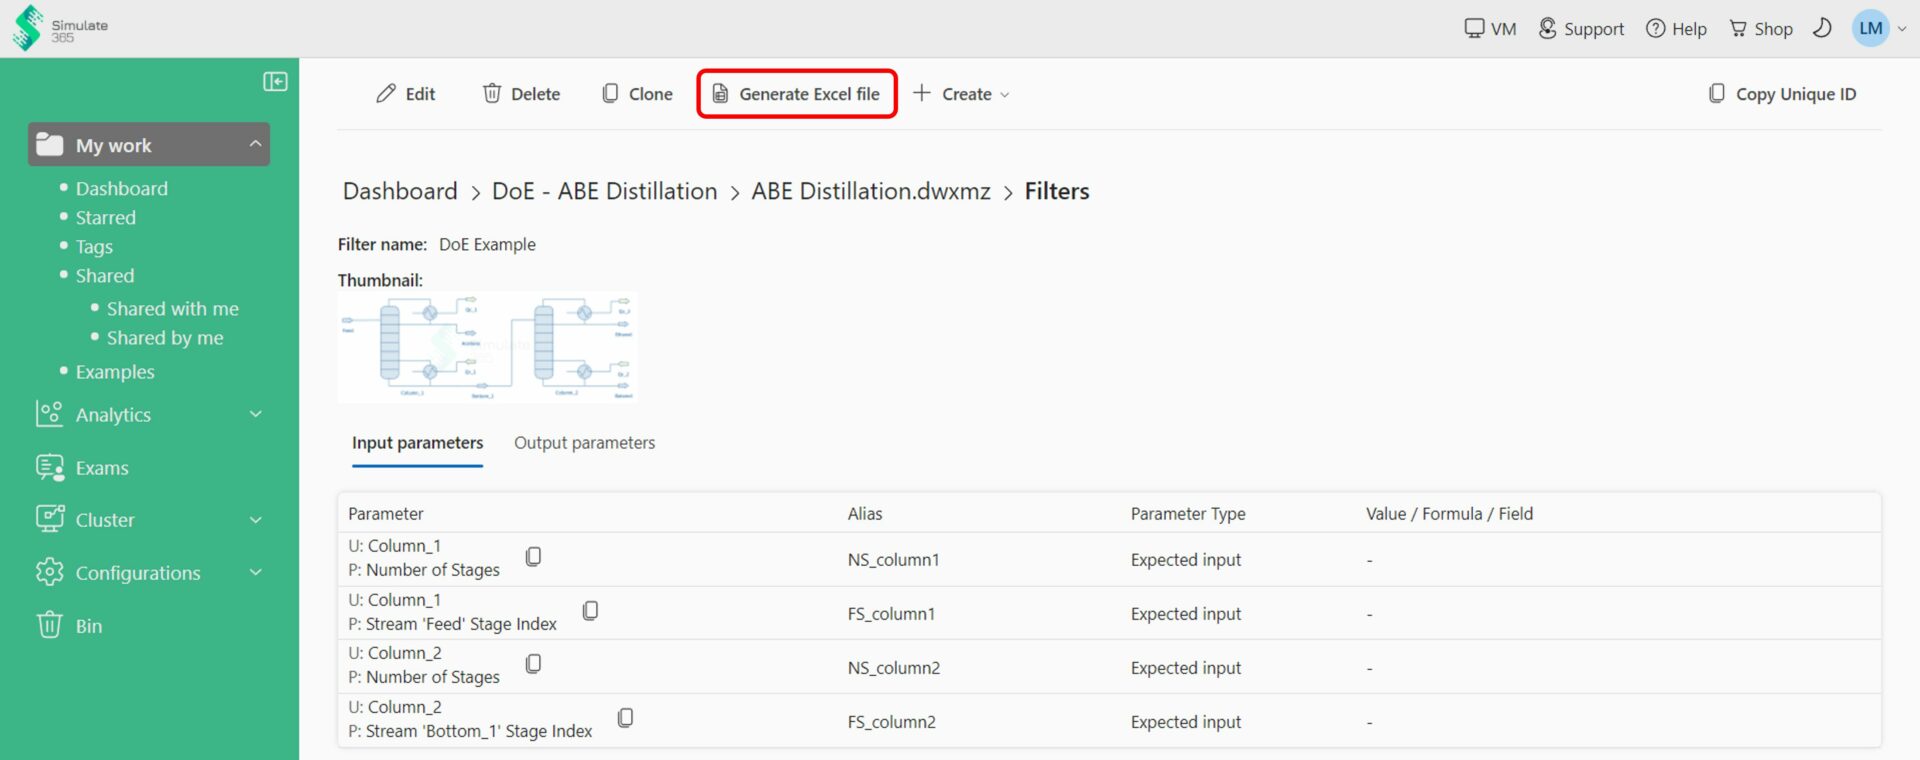
Step 3: Set up your DoE
Generate the Excel file from your Filter and save it to your Dashboard.
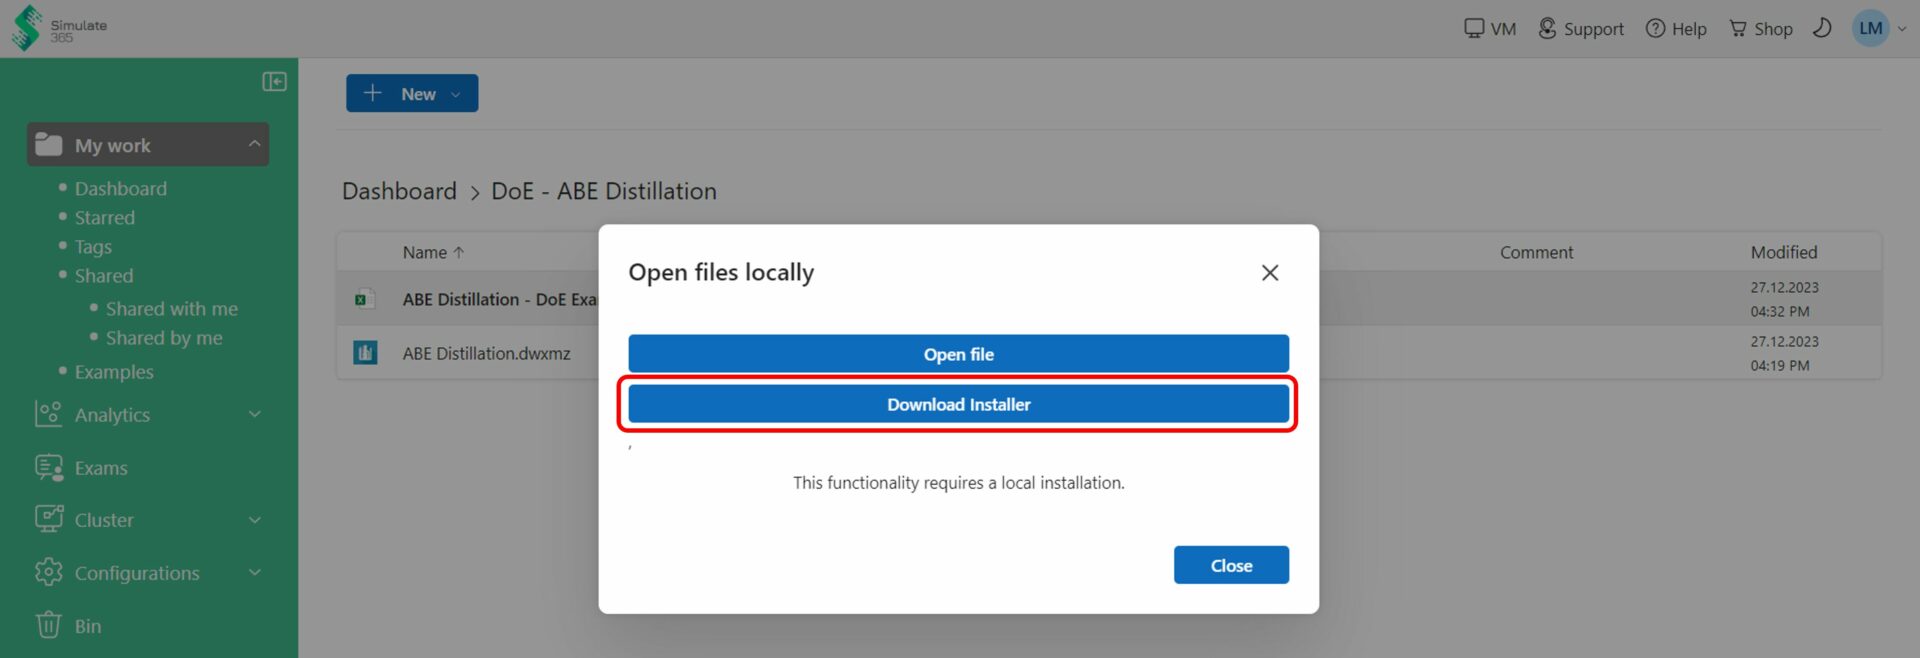
Open your Excel file locally via Right-Click. This functionality requires an installation of the Simulate 365 File Opener. The File Opener allows you to open and edit your file locally, and save it back to your Dashboard.
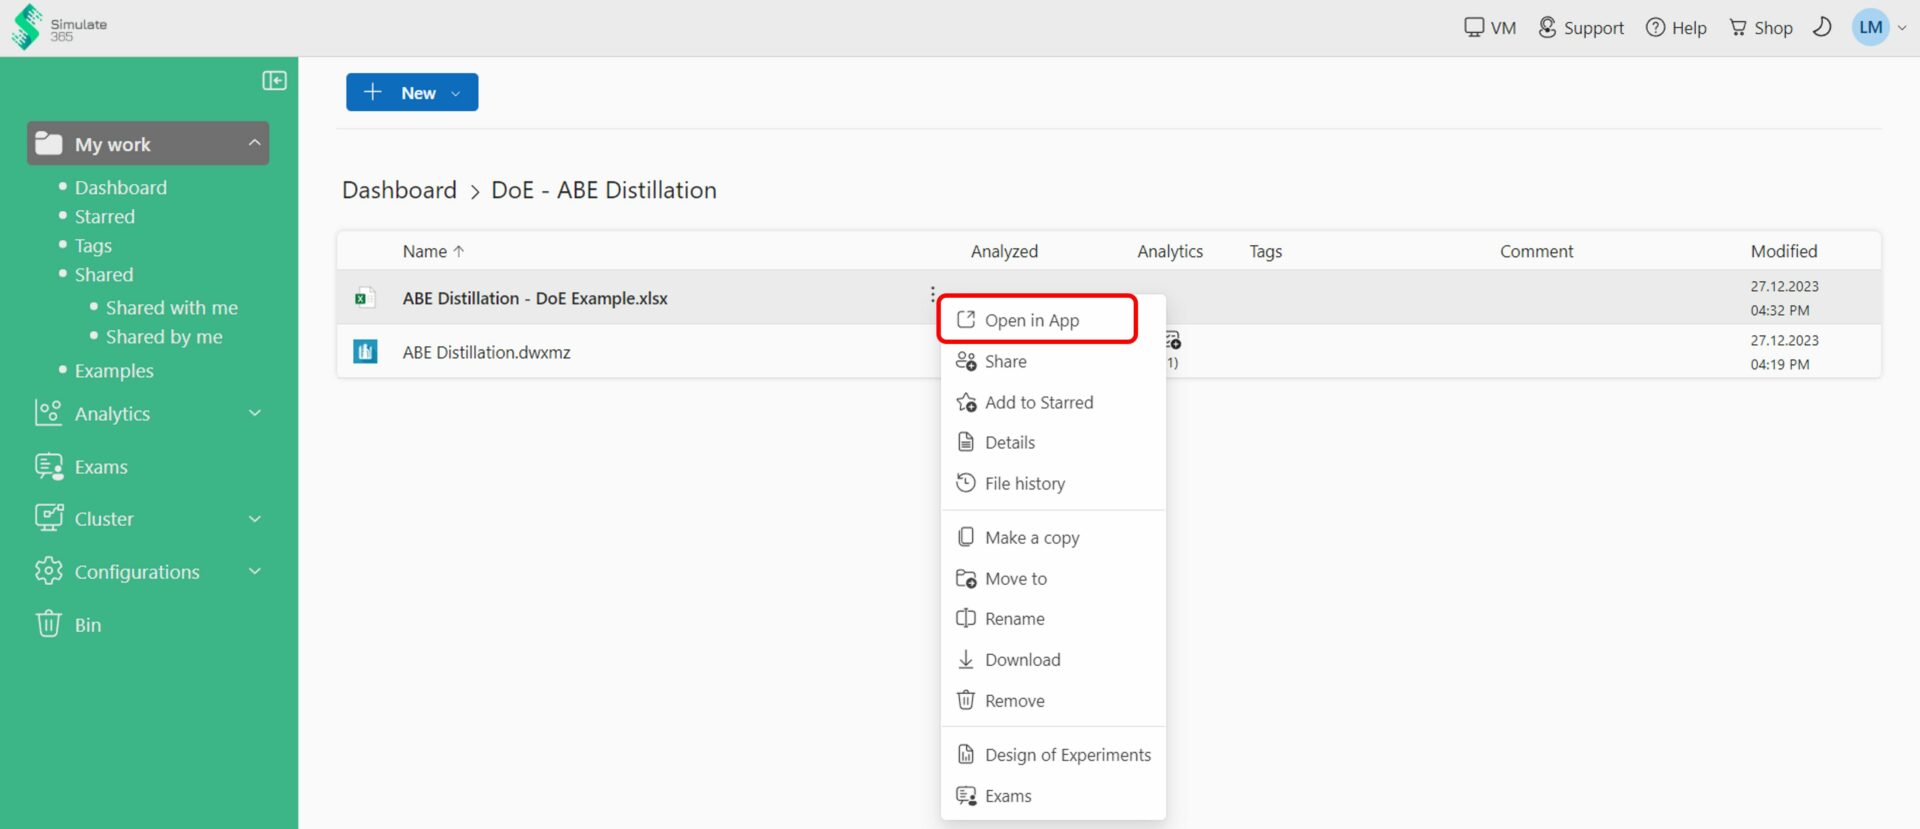
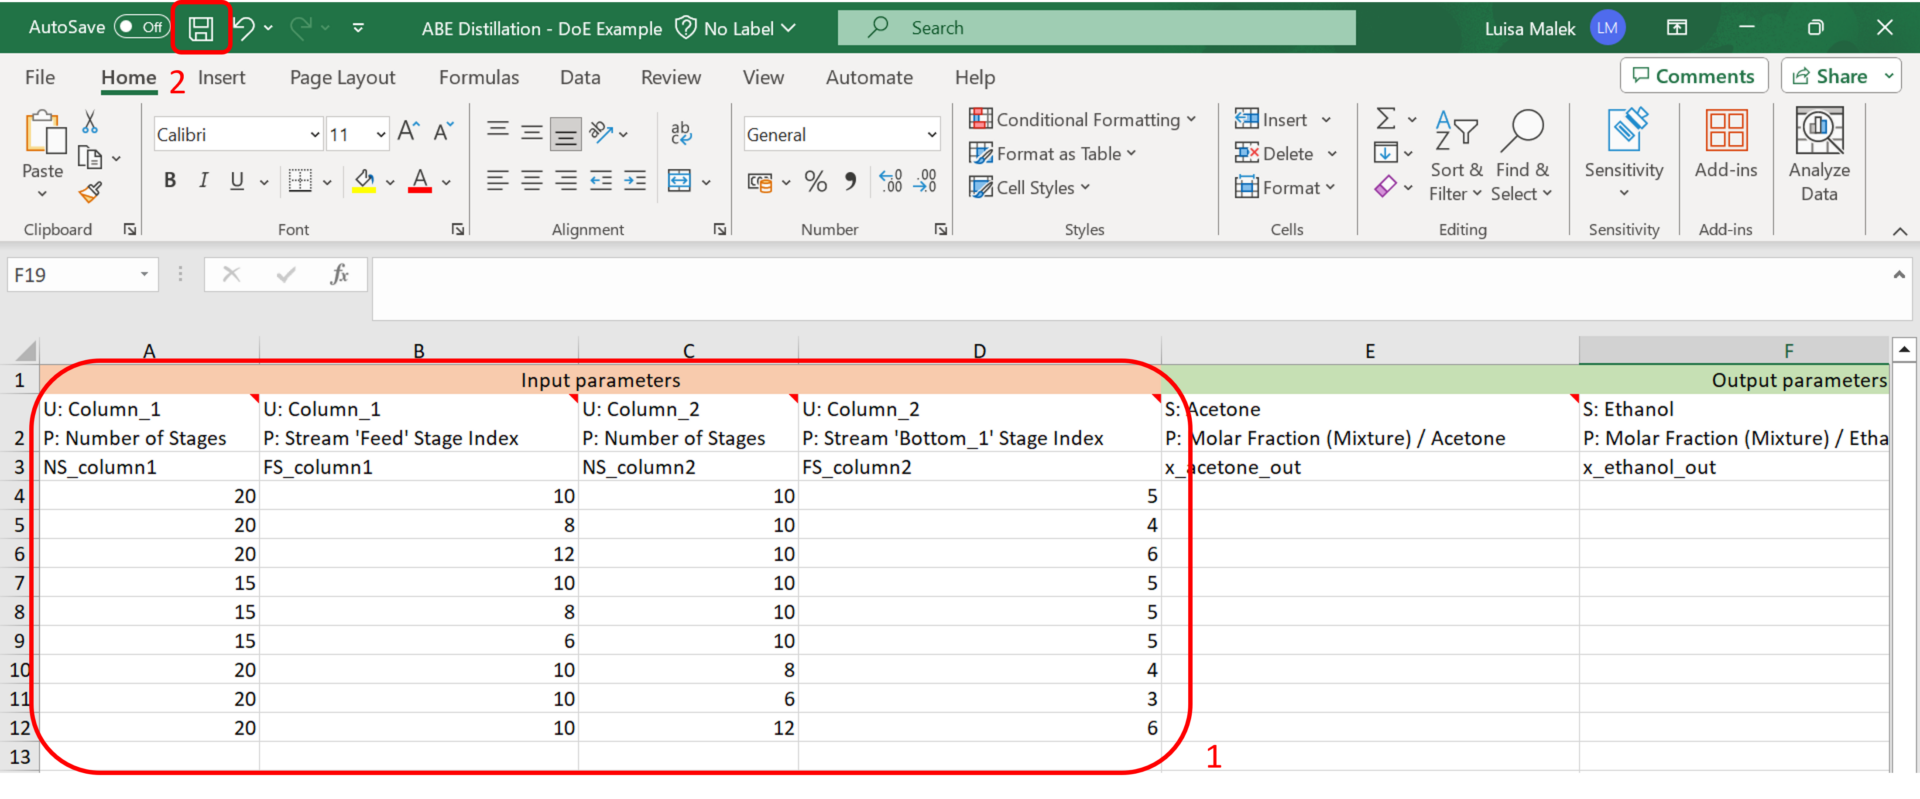
Fill in your input data according to your preferred sampling strategy and save the Excel file back to your Dashboard.
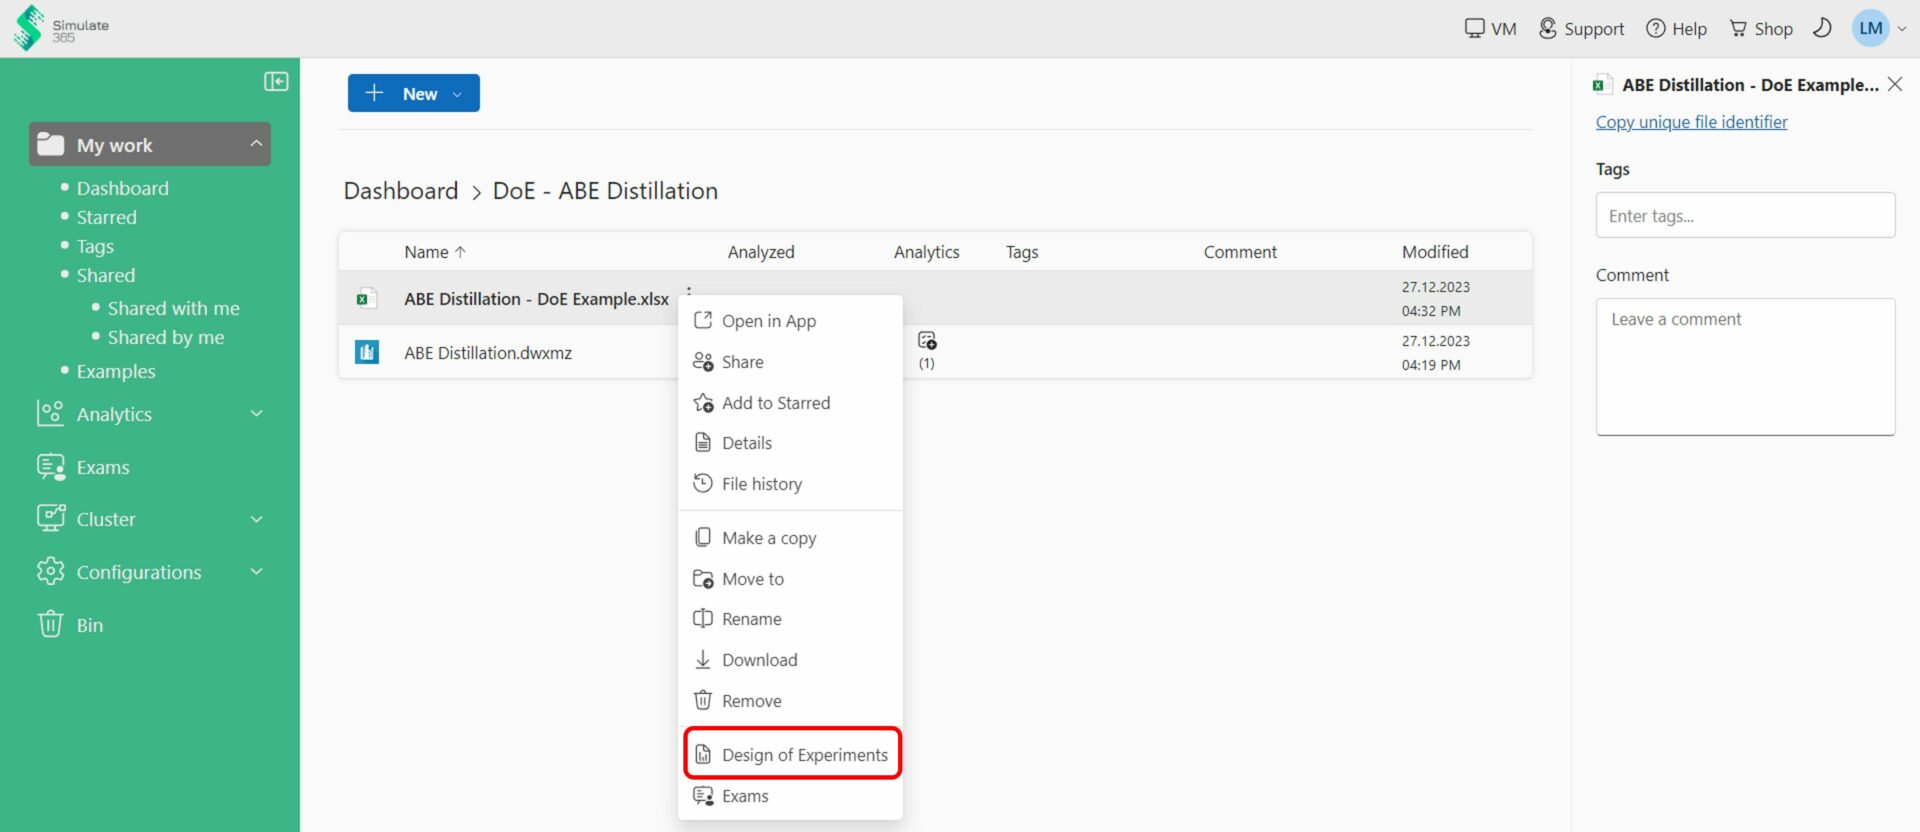
Access Design of Experiments via right-click on your Excel file.
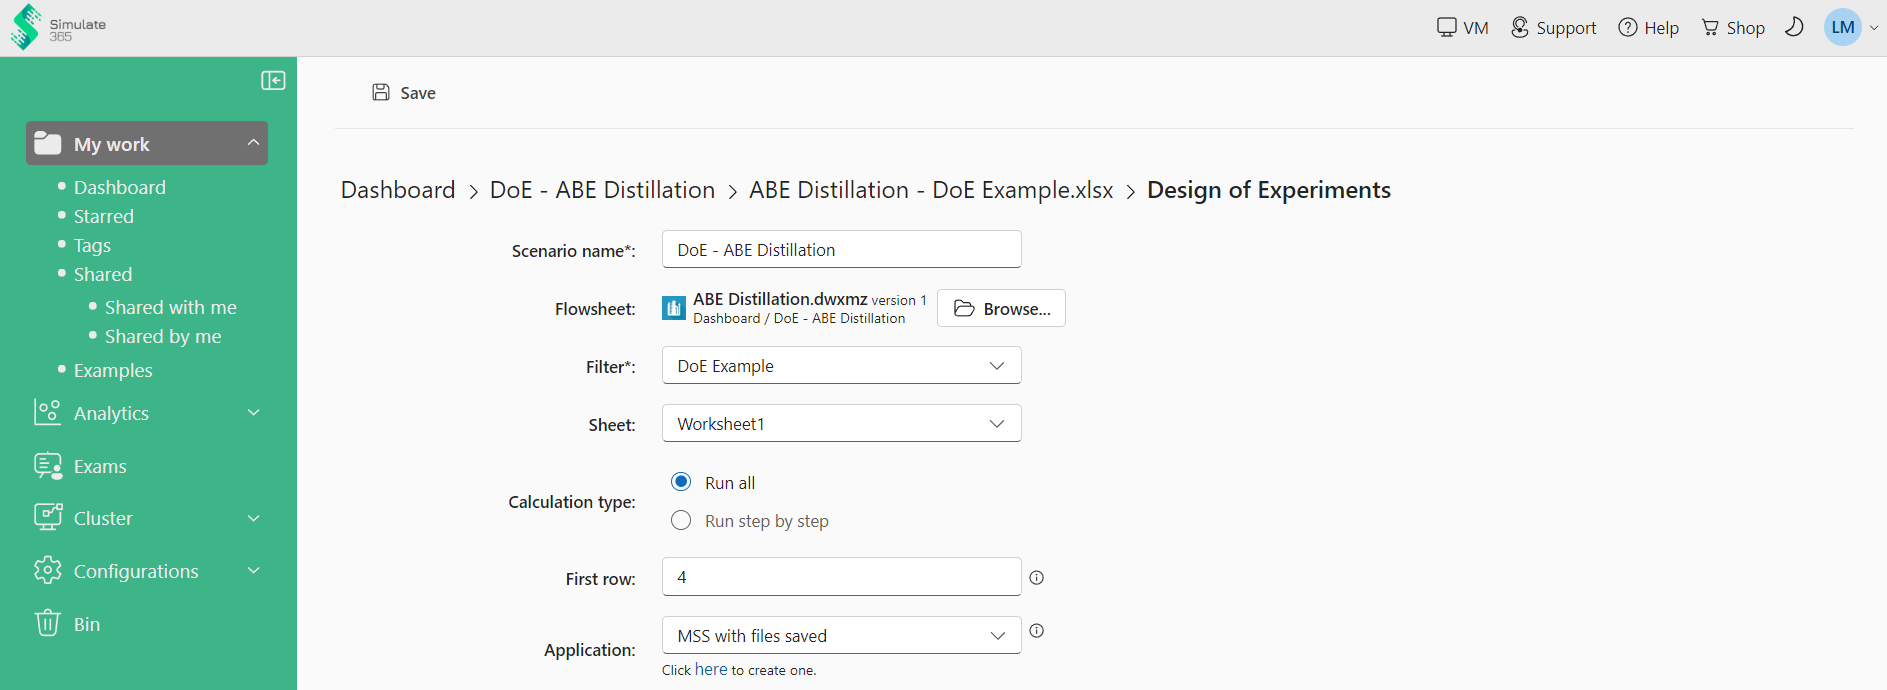
Select a name, your flowsheet and the corresponding Filter. Select the row in your Excel file where your input data is filled in and an Application. The Application allows you to define configurations for your calculations. You can reuse applications for all design tools on Dashboard.
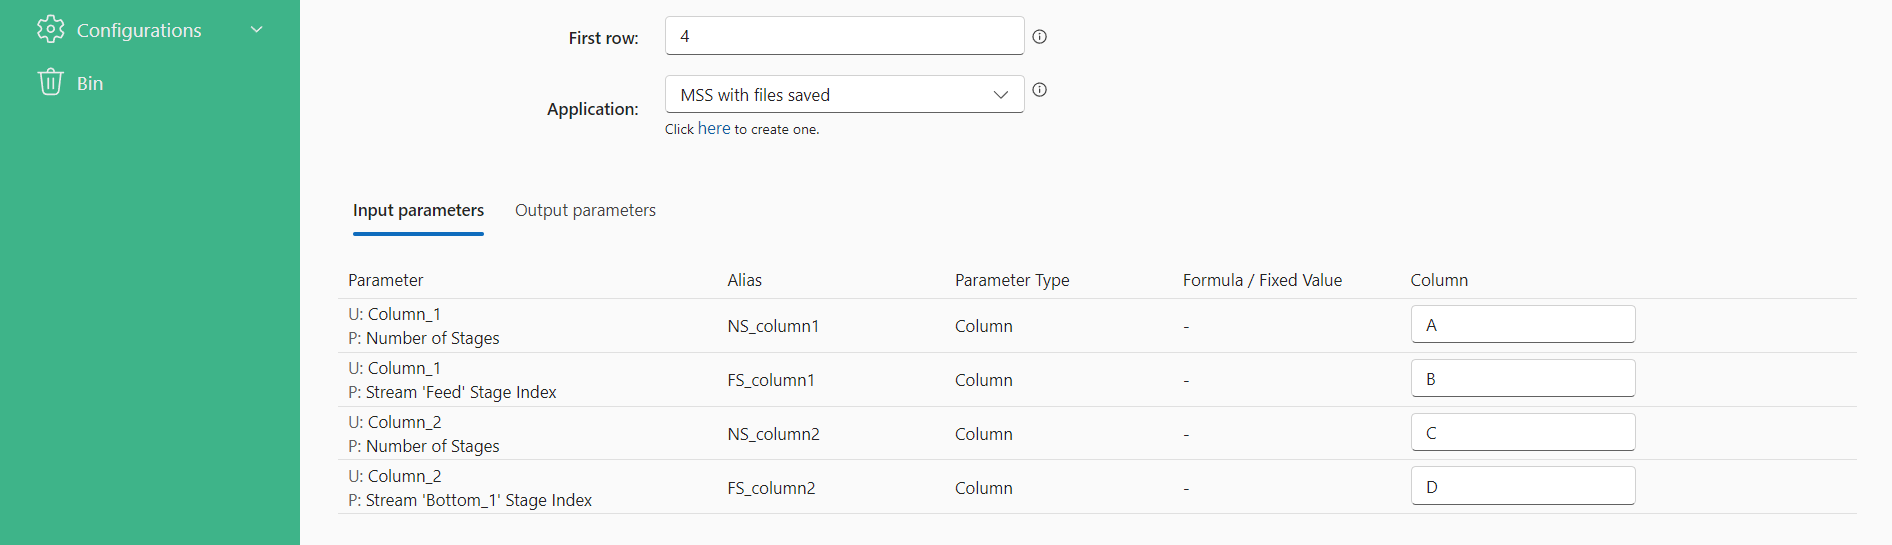
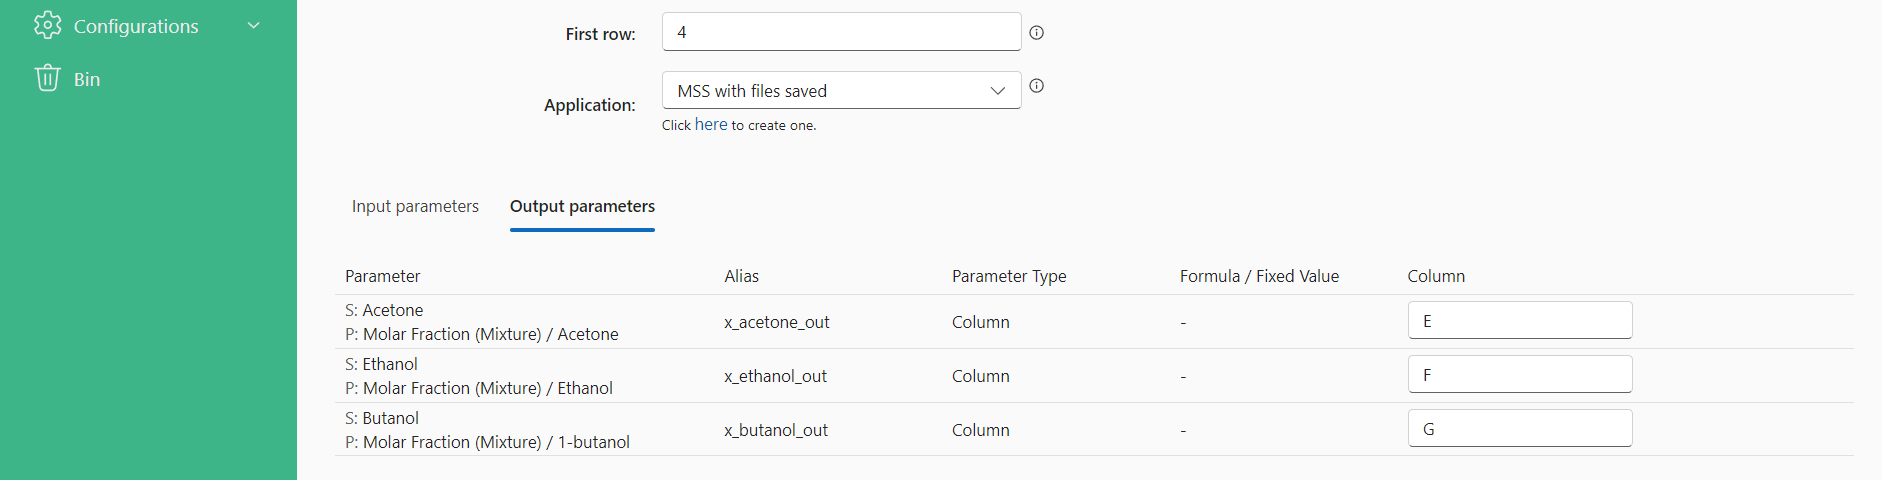
Select the corresponding column for each input and output from your Excel file.
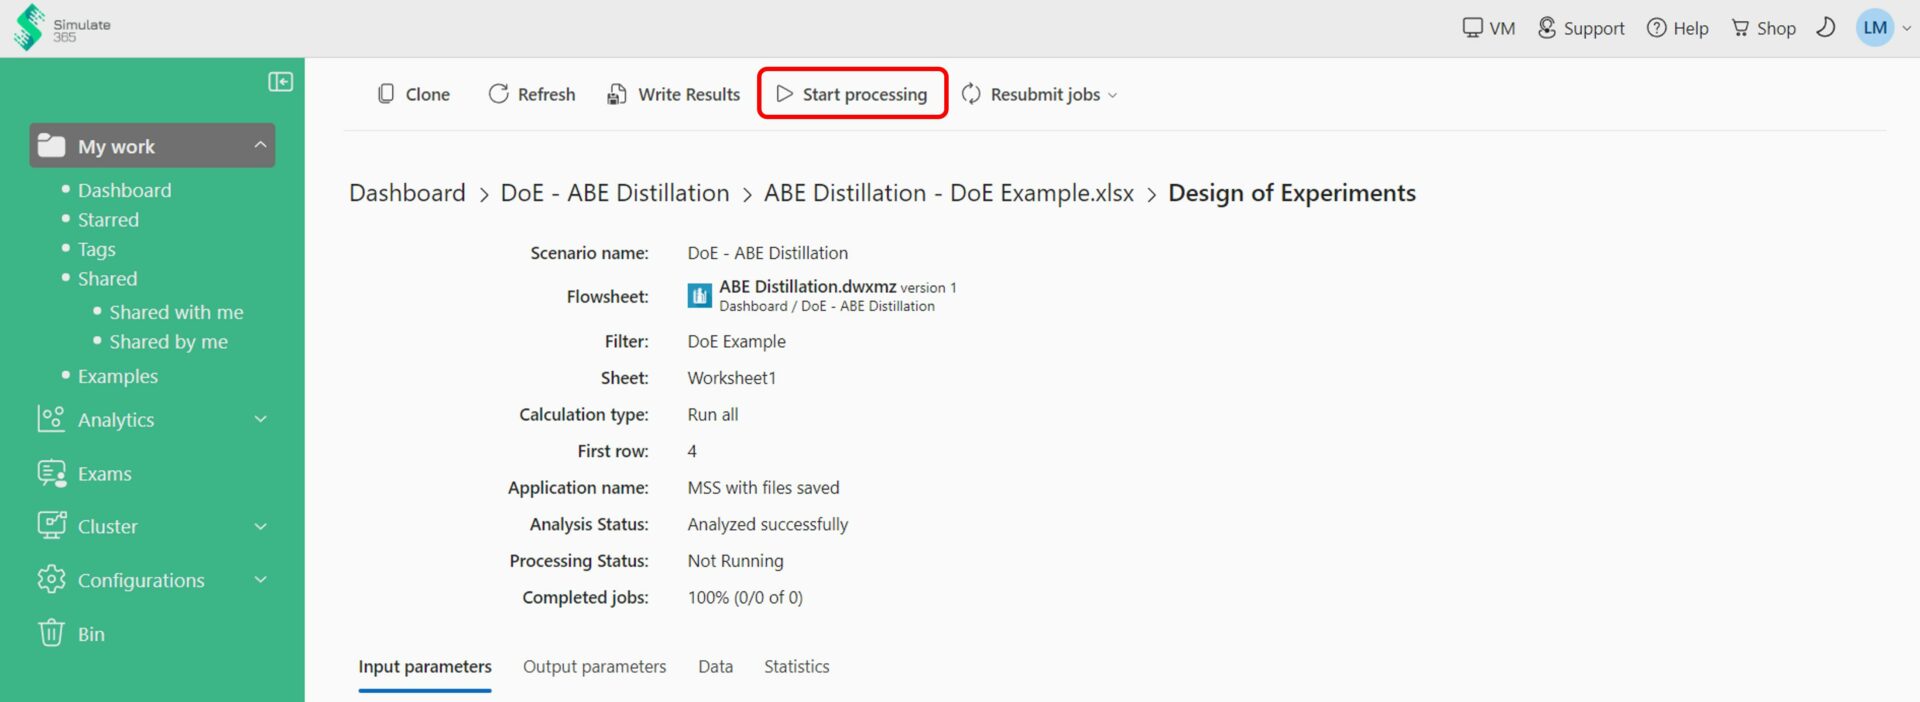
Save the scenario and start the calculations.
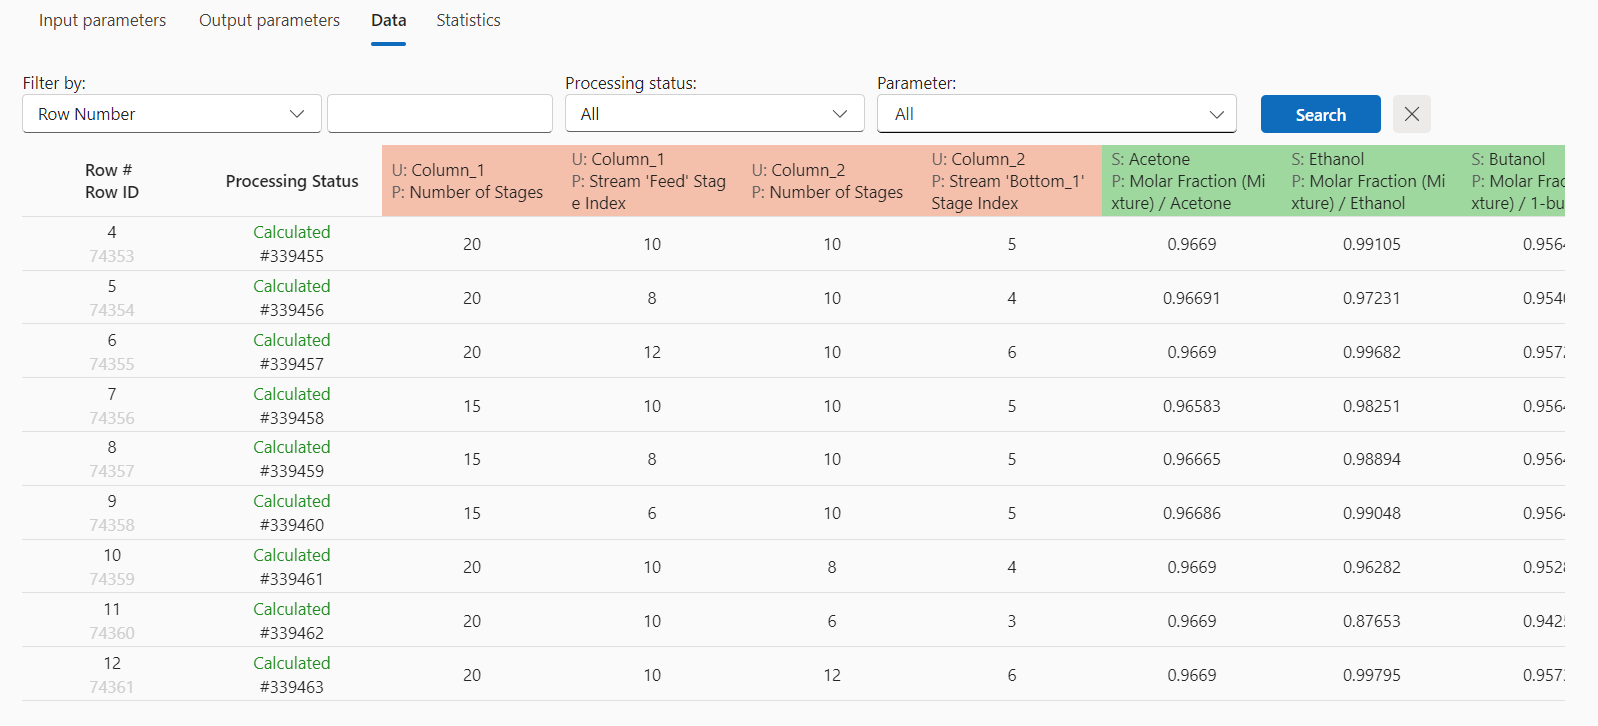
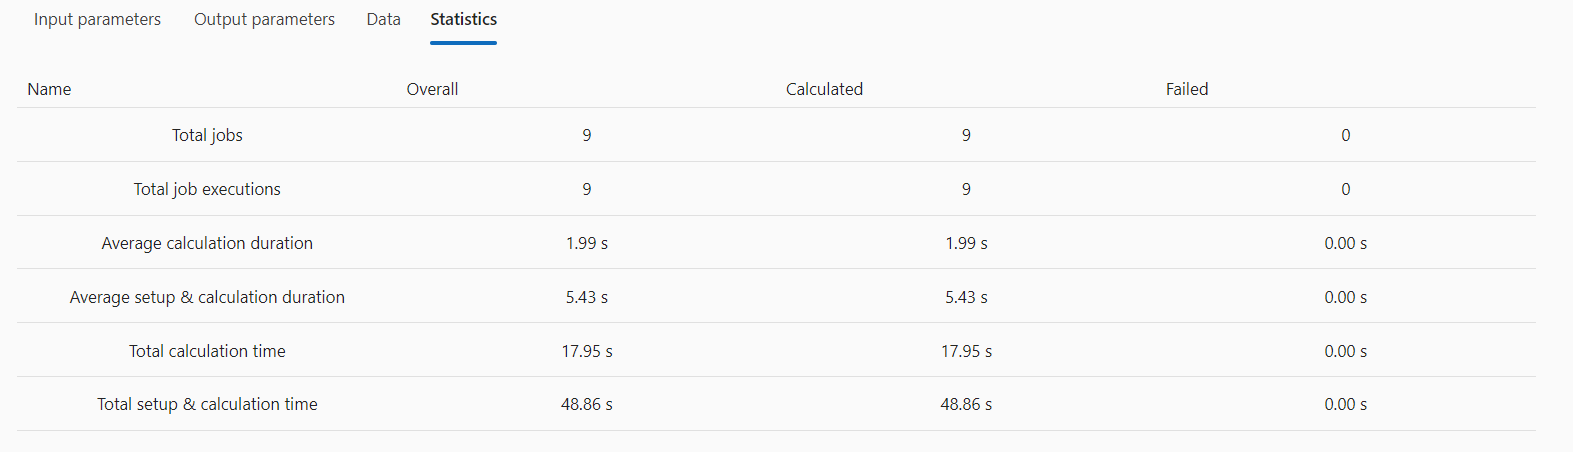
After your calculation is finished, you can view results in the Data tab. The Statistics tab shows you the number of calculated jobs including average and total calculation times.
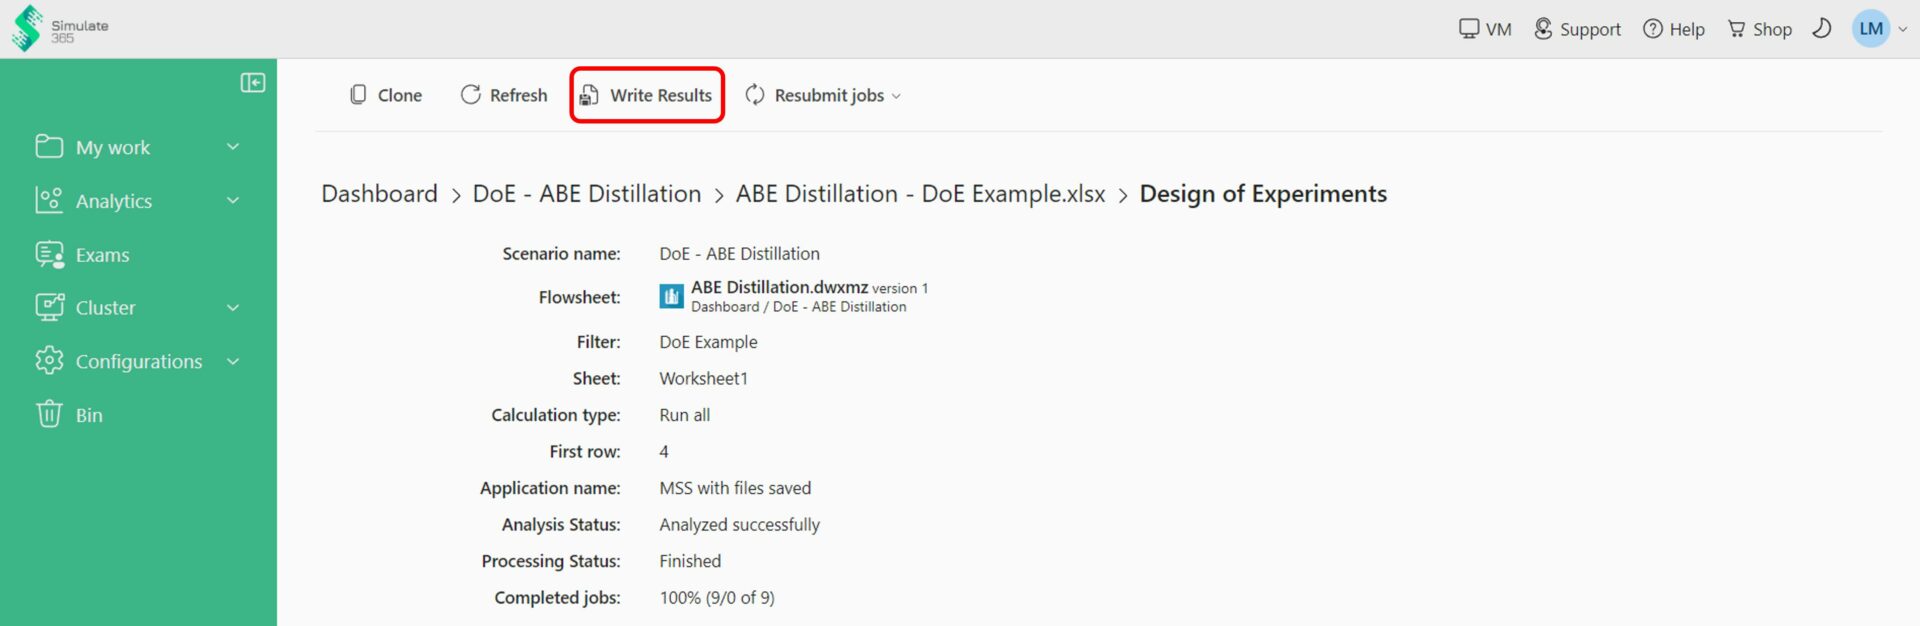
As last step, write your calculated outputs to your Excel file so you can open them locally.