Multivariate Sensitivity Study
to know your process
What is Multivariate Sensitivity Study?
Multivariate Sensitivity Study examines multiple input and output relationships and reveals their effects on process results.
It identifies parameters with a critical impact on the operating areas of the process. It allows for testing the alternative constraints and objectives.
For fast calculation, a Multivariate Sensitivity Study is calculated on a cluster of CHEMCAD / DWSIM instances.
It is for every engineer who wants to visualize the process behavior, get valuable insights for optimized operations, and improve energy and production efficiencies.
You can get the Multivariate Sensitivity Study here.
Why use the Multivariate Sensitivity Study?
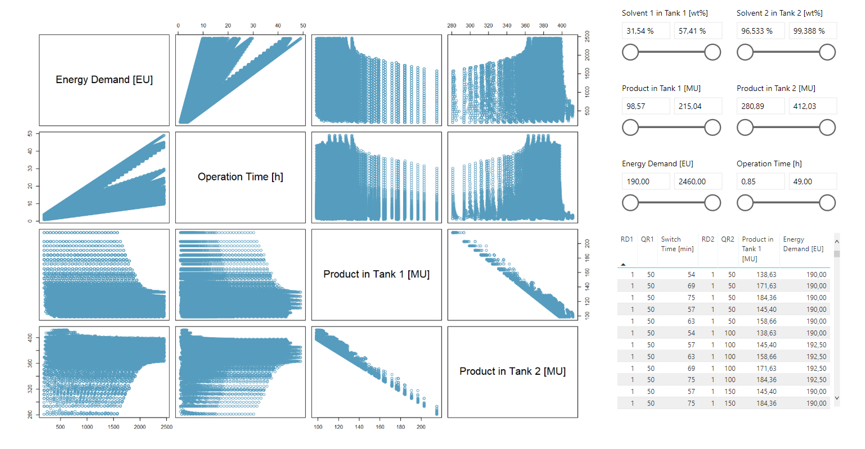
Apply constraints with filters
You discover parameter dependencies and dimension reductions using big data analytics
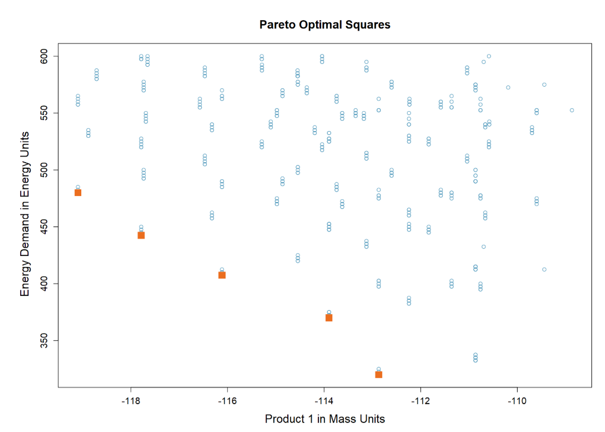
Find pareto-optimal solutions
You visualize solution spaces and pareto fronts for multi-objective optimization problems
Multivariate Sensitivity Study (MSS) is an application hosted on Dashboard, our simulation platform developed for process engineers working with flowsheets.
How sensitive is your process to parameter changes?
Learn more from our use cases
Case 1- Optimization of a Batch Distillation for Solvent Recovery
- Minimize energy demand
- Minimize operation time
- Maximize product yield
- Product concentration as a constraint
- Five design variables
- Equidistant grid (per variable)
- 78.125 flowsheet calculated (mass transfer batch column simulation)
Increased the solvent recovery efficiency
- 74% energy saving
- 4.5 h reduction in operation time
- 7% increase in product yield
- Infeasible design specifications cause convergence problems
- Due to product accumulation, product specifications must be given indirectly as design specifications
- The correlation of design and state variables are not obvious
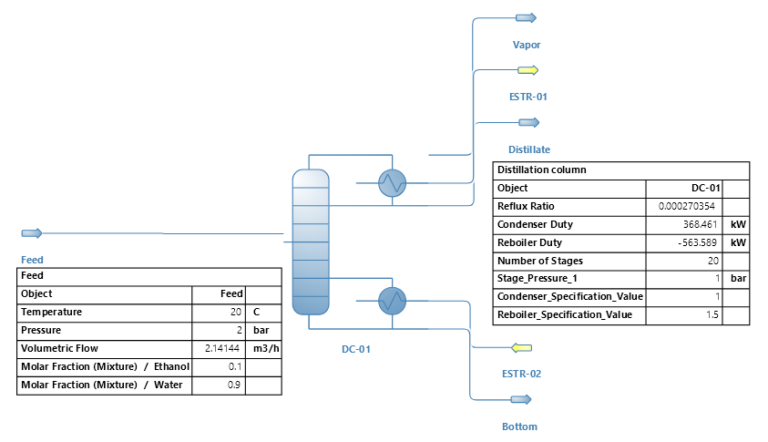
Case 2- Distillation of an Ethanol-Water Mixture (see video)
- Maximize product yield
- Minimize energy demand
- Product concentration as a constraint
- Two design variables
- Equidistant grid (per variable)
- 9.550 flowsheet calculated (SCDS)
Understand the correlations between variables
Flowsheet (CHEMCAD)
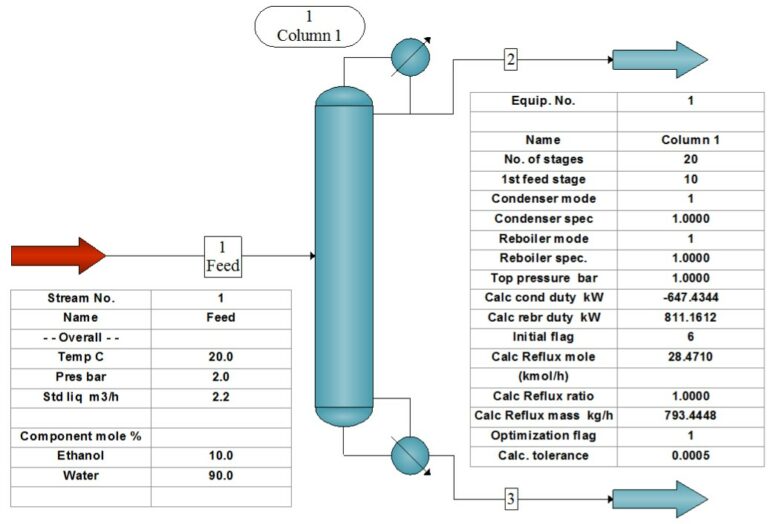
Flowsheet (DWSIM)
Interactive Data Explorer
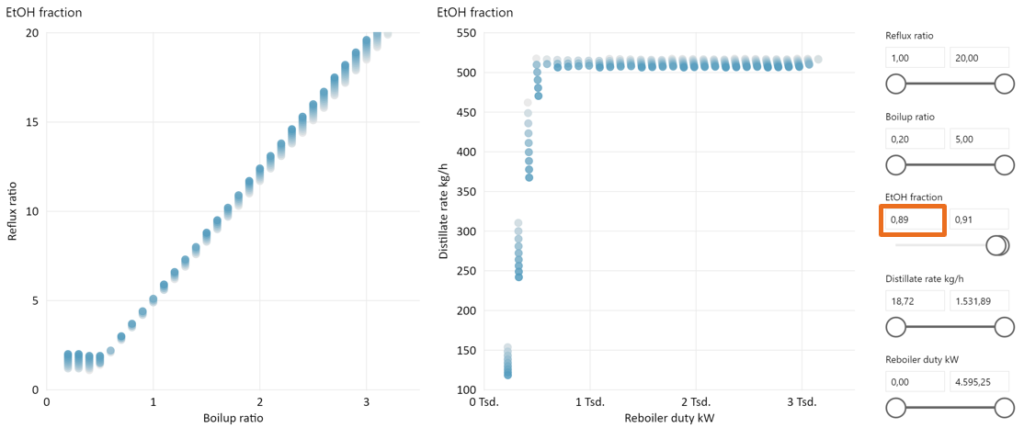
Use the sliders on the report below to apply limitations! Observe the relationship between variables.
- EtOH fraction
- Distillate rate
- Reboiler duty

